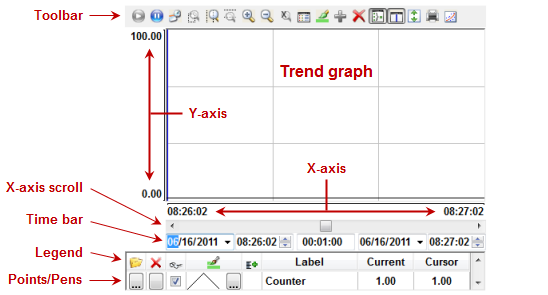
About the trend control runtime interface
During project runtime, a trend control has its own built-in interface that the operator can use to change how trends are displayed. This section describes the major parts of the interface and how they are used.

Toolbar
| Command/Tool | Icon | Description | Activation Tag |
|---|---|---|---|
| Run |  | Sets the trend control to Run Mode (a.k.a. Online Mode). In this mode, the X-axis continues to scroll with the passage of time and the trends are updated with current tag values. |
0 = stop trend 1 = run trend Changing the value of this tag also changes the value of the activation tag for Stop. |
| Stop |  | Sets the trend control to Stop Mode (a.k.a. Historical Mode). In this mode, the X-axis is stopped and the trends display only historical data.
If decimation is enabled for one or more trends, the calculation and redrawing is done only in this mode. |
0 = run trend 1 = stop trend Changing the value of this tag also changes the value of the activation tag for Run. |
| Period |  | Opens a dialog which can be used to modify the X-axis scale main settings. | 1 = open dialog
Resets to 0 after open. |
| Window Zoom |  | Allows the user to click on the trend graph and drag the cursor to select the area that must be visible when the cursor is released.
This option is disabled when the Multiple Section option (for the Y scale) is active. | 0 = disable zoom
1 = enable zoom Resets to 0 after user input. |
| Horizontal Zoom |  | Allows the user to click on two points in the trend graph, defining the horizontal scale that must be available. | |
| Vertical Zoom |  | Allows the user to click on two points in the trend graph, defining the vertical scale that must be available.
This option is disabled when the Multiple Section option (for the Y scale) is active. | |
| Zoom In |  | Zooms in (i.e., halves the current X and Y scales) each time the user clicks the tool. | 1 = execute command
Resets to 0 after execution. |
| Zoom Out |  | Zooms in (i.e., doubles the current X and Y scales) each time the user clicks the tool. | |
| Cancel Zoom |  | Cancels the current zoom and returns the trend graph to its original scale. | |
| Legend Properties |  | Opens a dialog which can be used to modify the Legend main settings. | |
| Pen Style |  | Opens a dialog which can be used to modify the pen style of the selected trend. | |
| Add Pen |  | Opens a dialog which can be used to add a new trend to the trend control. | |
| Remove Pen |  | Removes the selected trend from the trend control. | |
| Multiple Sections |  | Switches the Y scale between Multiple Sections (a section for each trend) and Single Section (all trend share the same Y scale section). |
0 = Single Section 1 = Multiple Sections |
| Cursor |  | Switches the cursor (ruler) between visible and hidden. |
0 = Cursor hidden 1 = Cursor visible |
| Auto Scale |  | Changes the Y axis scale to fit all values from the trends that are currently being monitored. | 1 = execute command
Resets to 0 after execution. |
 | Prints the current state of the trend control. (Historical data are not printed.) | ||
| SPC |  | Opens a dialog which can be used to show the statistical process control (SPC) information for the selected trend:

|
The tag’s Bit properties (B0–B4) can be used to open the dialog and pre-select options:
|
For more information, see Toolbar dialog.
Time bar
The time bar displays the start date/time and end date/time of the graph, or in other words, the period of the X axis. For more information, see Axes dialog.
If you have configured the trend control to display historical data from a batch file, you can change these dates and times during project run time and therefore increase or decrease the period of the graph. The longer the period, the more data the graph will display but at lower resolution. The shorter the period, the less data the graph will display but at higher resolution. This is similar to using the Horizontal Zoom tool.
Legend
| Command | Icon | Description |
|---|---|---|
| Selection |  | Launches a dialog, where the user can replace the data point associated with the selected trend on the legend |
| Remove |  | Removes the selected trend from the trend control |
| Hide |  | When checked, the selected trend is visible; otherwise, it is hidden. |
| Pen Style |  | Launches an embedded dialog, where the user can modify the pen style of the selected trend. |
| Scale |  | When this box is checked, the Y axis scale is visible; otherwise, it is hidden. The scale can be hidden only when the Multiple Sections option is off. |
For more information, see Legend dialog.