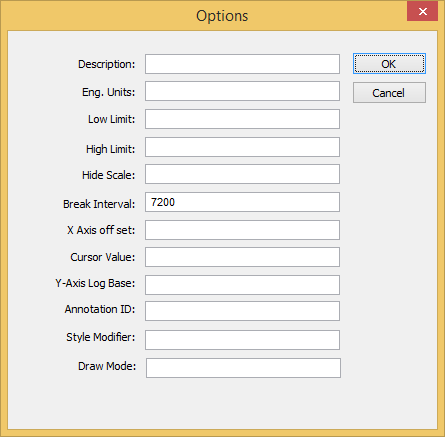
Options
Use the Options dialog box to configure additional options for a specific point in a Trend Control object.
Accessing the dialog box
To access the Options dialog box for a specific point: first access the Points dialog box, where all of the points in a Trend Control object are configured, and then click the Options column for that point. For more information, see Trend Control object.
The dialog box in detail

- Description
- This text can be displayed in the legend of the Trend Control object during run time, providing a brief description of the trend.
If you specify a tag name in curly brackets (e.g., {MyTag}), that tag’s Description property is used.
- Eng. Unit
- This text can be displayed in the legend of the Trend Control object during run time, providing the engineering unit (i.e., the unit of measurement) associated with the trend.
If you specify a tag name in curly brackets (e.g., {MyTag}), that tag’s Engineering Unit property is used.
- Lo Limit
- Type a tag name or numerical value. When the trend falls below this value during run time, it can be drawn in a different style (e.g., color). For more information, see Pen Style dialog box.
If you specify a tag name in curly brackets (e.g., {MyTag}), that tag’s LoLimit property is used.
- Hi Limit
- Type a tag name or numerical value. When the trend rises above this value during run time, it can be drawn in a different style (e.g., color). For more information, see Pen Style dialog box.
If you specify a tag name in curly brackets (e.g., {MyTag}), that tag’s HiLimit property is used.
- Hide Scale
- You can configure a tag in this field to control the visibility of the scale (Y axis) associated with this pen during runtime by changing the value of this tag (0=Show ; 1=Hide).
- Break Interval
- Type a numerical value (default is 7200). This is the maximum interval allowed between two consecutive points in a trend. If the interval between the two points is greater than this value, the Trend Control object assumes that no data were collected during the interval and it does not draw a line connecting the two points.
If the X axis is configured to be numeric, the value specified here is taken as a numeric scalar value. If the X axis is configured to be date/time, the value specified here is taken as seconds.
This setting accepts some special values:
Value Description -1 Do not connect any points. -2 Connect only points that have ascending values. - X Axis Offset
- Type a tag name or numerical value. The value is the offset from the X-axis scale configured for the Trend Control object. This setting is useful when you want to display data from two or more trends using a different scale for each trend, so that you can compare them.
If the X axis is configured to be numeric, the value specified here is taken as a numeric scalar value. If the X axis is configured to be date/time, the value specified here is taken as seconds.
- Cursor Value
- Type the name of a project tag. During run time, the tag is continuously updated with the value of the trend where it is intersected by the vertical cursor (if any) in the Trend Control object.
- Y-Axis Log Base
- Type a tag name or numerical value. If the value is 0 (or the box is left empty), the Y axis of the trend is a normal linear scale. If the value is anything other than 0, the Y axis is a logarithmic scale with a log base equal to that value. The most common log base is 1, which gives a scale of 1, 10, 100, 1000, and so on, but you can specify any log base.
- Annotation ID
- Style Modifier
- Modify the pen style’s expansion, line color, line weight, or line type. For more information, see Modify the pen style of a point during run time.
- Draw Mode
- Type a tag name or numerical value. If the value is 1, the historical data for this trend are decimated before the trend is drawn in the Trend Control object. That means the trend’s X axis is divided into a number of intervals (as determined by Max Points in the Advanced settings), and then all of the data points within each interval are averaged together to be drawn as a single point.
This is similar to the Decimation option in the Advanced settings, except that the decimation is done only for this trend rather than for all trends in the Trend Control object.
Note: If decimation is enabled and the X axis is configured to be numeric rather than date/time, the data used in the X axis must be properly sorted. For more information, see the Data Sources settings.Note: If the data source for the point is a tag from a Trend worksheet that has been configured to save to a Wonderware Historian database, decimation must be enabled.