SPC
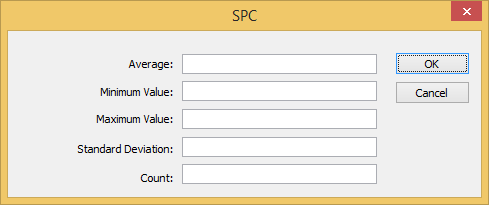
Use the SPC dialog box to specify project tags that will receive certain statistical values that are calculated from the entire history of a trend. These statistics are used in statistical process control (SPC), which is a method for monitoring processes and ensuring that they operate efficiently.
Accessing the dialog box
To access the SPC dialog box for a specific point: first access the Points dialog box, where all of the points in a Trend Control object are configured, and then click the SPC column for that point. For more information, see Trend Control object.
Note: If the data source for the point is a tag in a Trend worksheet that has been configured to save to a Wonderware Historian database, SPC is not supported.
The dialog box in detail
Figure 1. SPC dialog box


The SPC dialog box includes the following settings:
- Average
- Type the name of a project tag (Real type) that will receive the calculated average of all of the data point’s historical values.
Note: When a value is not a number (NaN) — for example, when a tag is flagged as BAD quality — it is counted as 0 for the purpose of calculating the average.
- Minimum Value
- Type the name of a project tag (Real type) that will receive the minimum historical value of the data point.
- Maximum Value
- Type the name of a project tag (Real type) that will receive the maximum historical value of the data point.
- Standard Deviation
- Type the name of a project tag (Real type) that will receive the standard deviation of the data point. A low standard deviation indicates that the value of the data point tends to stay close to the average; a high standard deviation indicates that the value tends to vary greatly from the average.
- Count
- Type the name of a project tag (Integer or Real type) that will receive the total number of historical values, or samples, for the data point. The count will increase as the project runs and the historical database grows.