Bargraph animation
On the Graphics tab, in the Animations group, click Bargraph to add bar graph properties to a selected object, then double-click on the object to open the Object Properties dialog.
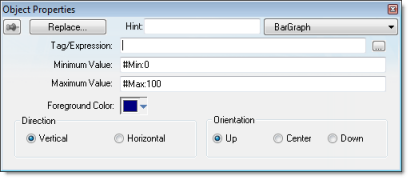
Figure 1. Object Properties: BarGraph


Use the Object Properties dialog to specify the following parameters:
- Tag/Expression field: Type a tag or expression that evaluates the bar graph level. You also can click the icon to browse your directories for an existing tag or expression.
- Minimum Value field: Type a numeric constant or a tag value into this field to define the minimum value used to calculate the height (if vertical) or width (if horizontal) of the bars.
- Maximum Value field: Type a numeric constant or a tag value into this field to define the maximum value used to calculate the height (if vertical) or width (if horizontal) of the bars.
If you do not specify a value for this field, the application opens a dialog requesting you confirm creation of the tag.
Tip: The application also allows you to enter constants in tag/numeric value fields. Constant values (defined by the # character) are equivalent to numeric values, except that constants display in the Tag Replace dialog. You may find constants useful for documentation purposes or for creating generic objects.For example: #Name:100.
Where the value (100) following the semicolon ( : ) is the constant, and Name is a constant mnemonic only and not added to database.
- Foreground Color: To specify a fill color for the bars, click the combo-box button. When the Color dialog displays, click on a color to select it, and then close the dialog.
- Direction area: Click the Vertical or Horizontal radio button to specify the direction of the bar graph.
- Orientation area: Click the Up, Center, or Down radio button to specify the orientation of the maximum and minimum values when drawing the bars.