Use the Trend control
Use the Trend control to view trend graphs of selected process values.
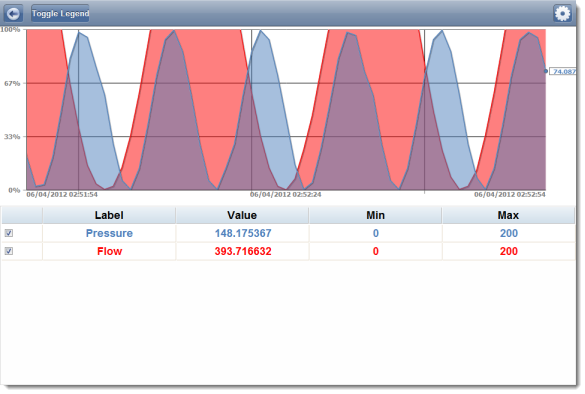
The Trend control is similar to the Trend Control screen object. It graphs the changes in process values over a specified duration, and it also saves a history of those changes.
Figure 1. An example of the Trend control


The X-axis of the graph is time, and the Y-axis is the value of the tags. The legend below the trend graph includes the following columns:
- Check Box
- Select to show the process value on the trend graph, or clear to hide it.
- Label
- The name of the process value. Please note that this may be different from the original tag name, depending on how you configure it in the Mobile Access Configuration worksheet.
- Value
- The current value of the project tag.
- Min and Max
- The Min and Max settings from the area settings. These are used to calculate the percentage on the Y-axis. For example, if Min is 10, Max is 20, and the actual value is 16, then the percentage is 60%.
By default, the Trend control runs in real-time (or “play”) mode with a duration of 60 seconds. That means the graph is continuously updated with the current values of the tags, and only the last 60 seconds are actually shown on the graph. However, you can change all of this in the Settings window. For more information, see below.
To use the Trend control:
- To hide or show the legend below the trend graph, click/tap Toggle Legend.
- To hide or show a specific process value on the trend graph, click/tap the check box in the first column.
- To add translucent fills below the trend lines:
- Click/tap the Settings button
 . The Settings screen is displayed.
- Toggle the Fill switch to ON.
- Click/tap Trend to apply your changes and return to the Trend control.
- Click/tap the Settings button
- To change the duration (i.e., the X-axis) of the trend graph:
- Click/tap the Settings button
 . The Settings screen is displayed.
- In the Duration text box, type the new duration in seconds.
- Click/tap Trend to apply your changes and return to the Trend control.
- Click/tap the Settings button
- To show the trend lines as absolute values rather than as percentages:
- Click/tap the Settings button
 . The Settings screen is displayed.
- Toggle the Percentage Mode switch to OFF.
- In the Min and Max boxes, type the minimum and maximum values for the Y-axis of the trend graph. These apply to all of the process values, overriding the values’ individual Min and Max settings that are used to calculate the percentages.
- Click/tap Trend to apply your changes and return to the Trend control.
- Click/tap the Settings button
- To switch the Trend control to historical mode:
- Click/tap the Settings button
 . The Settings screen is displayed.
- Toggle the Play switch to OFF. The Duration setting changes to Period.
- Click/tap Period. The Period screen is displayed.
- Use the date and time controls to set the From (start) and To (end) points of the graph’s X-axis.
- Click/tap Settings to apply your changes and return to the Settings screen.
- Click/tap Trend to apply your changes and return to the Trend control.
- Click/tap Toggle Cursor to turn on a vertical cursor that you can slide left and right on the trend graph, in order to see the process values at a specific time.
Note: The Toggle Cursor button is hidden when the Trend control is not in historical mode.
- Click/tap the Settings button
- To return to the home screen, click/tap the Return button
 .
.