Open the browser console to view the activity log
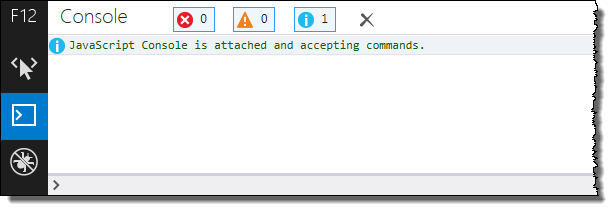
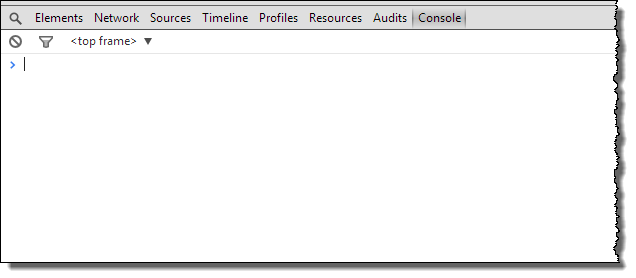
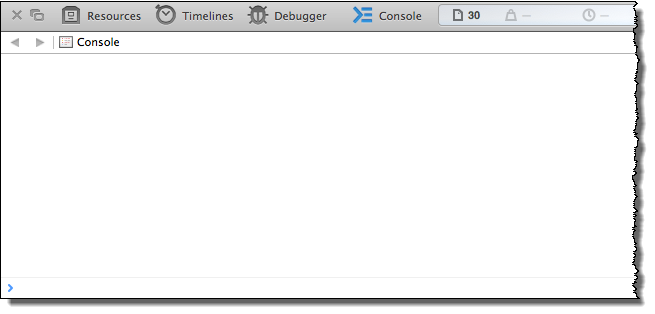
Open the browser console in Internet Explorer, Google Chrome, or Safari in order to view the activity log for the Mobile Access web interface.
The console is a part of the web browser’s developer tools, and it is used to troubleshoot code in a web page. When you are using the Mobile Access web interface, the console shows log messages for the project screen that you are currently viewing. For more information, see Use the activity log to troubleshoot a project screen.
Please note that you can open the browser console at any time, but it will not display any log messages unless both the project runtime server and the web server are running and you have successfully logged on to the web interface. For more information, see Log on to the Mobile Access web interface.
Internet Explorer
- Click the Action tool (i.e., the gear icon) on the toolbar, and then on the menu, click F12 Developer Tools; or
- Press F12 on the keyboard.

Google Chrome
- Click the Chrome tool (i.e., the menu icon) on the toolbar, and then on the menu, click Tools > JavaScript console; or
- Press Ctrl+Shift+J (Cmd+Option+J on Mac OS X) on the keyboard.

Safari
- Do one of the following:
- In Safari for Windows, click the Action tool (i.e., the gear icon) on the toolbar, and then on the menu, click Preferences; or
- In Safari for Mac OS X, click the Safari menu (i.e., the application menu) on the menu bar, click Preferences.
The Preferences window is displayed.
- Click the Advanced tab.
- Select the Show Develop menu in menu bar check box.
- Close the Preferences window.
- Do one of the following:
- In Safari for Windows, click the Page tool on the toolbar, and then on the menu, click Develop > Show Error Console; or
- In Safari for Mac OS X, click the Develop menu on the menu bar, and then on the menu, click Show Error Console.
