Use the activity log to troubleshoot a project screen
Use the activity log, which can be viewed in the browser console, to troubleshoot a project screen in the Mobile Access web interface.
This log is similar to but separate from the project runtime log that is displayed in the Output window; it comprises only messages that describe the behavior of project screens in the web interface.
Please keep in mind that the console only displays the log for the project screen that you are currently viewing. It does not display the logs for any other client sessions, neither on other computers nor in another client application (e.g., Secure Viewer) on the same computer. It also does not display any information about the project runtime server.
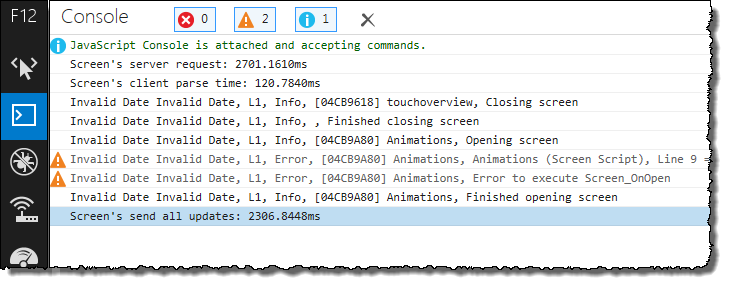
- Error
- These are messages about serious errors encountered during run time, like unsupported features used in a screen and run-time errors in the Mobile Access engine. Mobile Access errors are marked by the yellow “Warning” icon in most browser consoles.
- Warning
- These are warnings about things in your project screen that can affect run-time performance, such as excessive tag synchronization and function calls that must be executed on the server. Mobile Access warnings are marked by the blue “Message” or “Info” icon in most browser consoles.
- Info
- These are informational messages that report individual function calls, tag value changes, screen openings and closings, and so on, as well as any trace messages that you choose to include in your project. Mobile Access info messages are not marked by icons.
Use the activity log to troubleshoot an issue
Here is an example of how to use the activity log to troubleshoot an issue in one of your project screens.
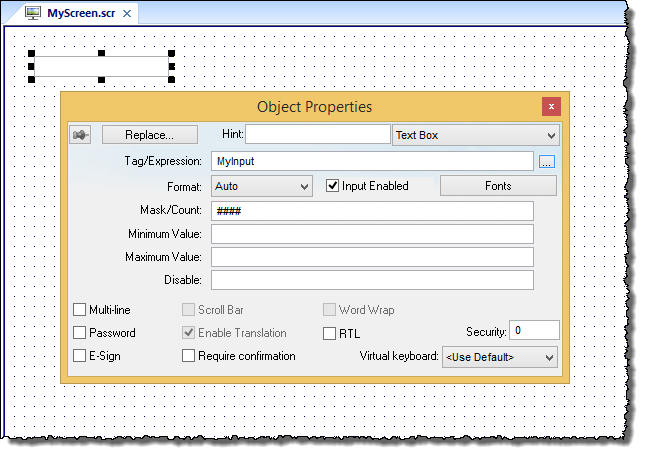
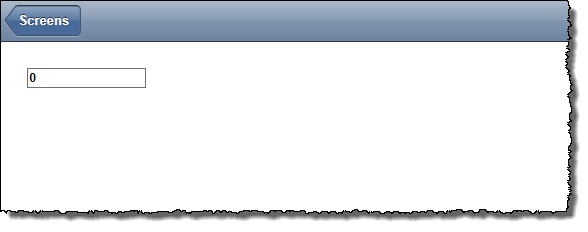
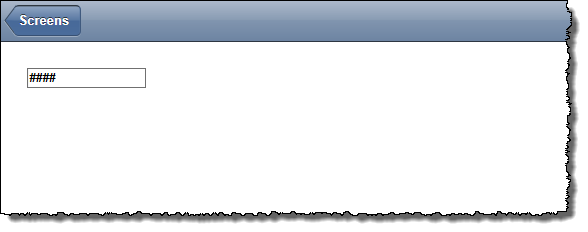
Verifying the project will catch things like missing tags, but in order to verify the project, you must be able to use the InduSoft Web Studio development environment to open and edit the project. The user typically will not be able to do that during run time.

Invalid Date Invalid Date, L1, Error, [04BF97E0] myscreen, myscreen (Screen Script) - Expression(1000000): MyInput, Line 1 => Error: Could not read objects database. Object MyInput not found [Error Code: 0x80070057]
The message provides the name of the screen, the name of the affected object or tag, and the exact nature of the error. With this information, you should get some idea of how to resolve the issue in your project. This is a very simple example, of course, and an issue like this typically will be included in a Level 1 log; more complex issues might require increasing the log level and searching through more messages. But this essentially is the procedure for using the activity log to troubleshoot a project screen in Mobile Access.
Increase the log level to get more information
By default, the activity log is set to level 1, which provides the least amount of information. If you have issues while using the Mobile Access web interface — especially while trying to view selected project screens — and the log does not help, you can increase the log level to get more information.
Be careful not to set the log level too high, however, because the higher it is, the more detailed and verbose the log will be, which might make it hard for you to find the information that will actually help you to resolve your issues. Try increasing the log level in steps, first from level 1 to level 2, then from level 2 to level 3, and so on until you get the information you need.
- If objects, animations, or scripts are not working at all, try level 1. This level should be enough to identify missing tags, unsupported features, and other such things. For more information, see List of features supported in project screens in Mobile Access.
- If a project screen is unusually slow to open or update, try level 3 (which includes levels 1–2). This level should help you to diagnose issues that affect run-time performance. For more information, see Tips for Mobile Access development and run time.
- If you simply do not see the behavior that you expect during run time, try level 5 (which includes levels 1–4). This level reports every tag update and function call.
Please note that these are only general suggestions; you will probably need to change the log level more than once to get the right amount of detail on your specific issues. For more information about changing the log level, see Configure the Mobile Access global settings.
Filter the activity log in the browser console
You can filter the activity log in the browser console in order to reduce the number of log messages that you must look through to find the information that you need. The tools for filtering the log vary by browser, so please consult the documentation for the browser that you are using.
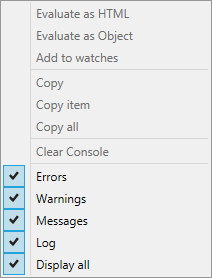
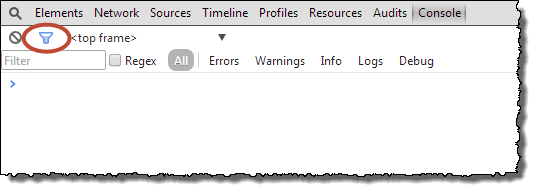
If you filter by message type, remember that Mobile Access errors are displayed as Warnings, Mobile Access warnings are displayed as Messages (in Internet Explorer) or Info (in Google Chrome), and Mobile Access info messages are displayed as Logs. Otherwise, you can try to filter by specific text.